Jekyll2026-03-06T23:42:47+00:00/feed.xmlquesadagranja.comHow NOT to win the lottery2022-02-26T00:00:00+00:002022-02-26T00:00:00+00:00/2022/02/26/how-not-winFeeling lucky? Don’t be fooled! “The Devil’s Dictionary”, written by Ambrose Bierce in 1911, calls the lottery a “tax on people who are bad at math.” With such low odds of winning the big prize, only those who have crunched the numbers will realize that hitting the jackpot is practically impossible. So, if you’re playing the lottery, you’re essentially paying a “voluntary” tax with no chance of a return on your investment.
Think you have a shot at winning EuroMillions? Think again! The odds of matching the winning numbers (5 out of 50 and 2 out of 12) are a staggering 1 in 139,838,160. That’s right, you’re more likely to get struck by lightning (odds of 1 in 1,222,000 per year according to an Irish insurance company) than hit the EuroMillions jackpot. And as if those odds weren’t bad enough, they’re even worse if you don’t live in a particularly rainy region - the chances of getting struck by lightning are still 114 times higher than winning the lottery! So, before you put all your hope (and money) into the EuroMillions, consider the math.
However, last month, the Spanish Bonoloto saw an extraordinary event—ten winners in a single draw! How did this happen, you ask? The odds of winning the Bonoloto (matching 6 out of 49 numbers) are already slim at 1 in 13,983,816. Something unlikely occurred—the winning numbers formed an arithmetic progression with a difference of 11.
1, 2, 13, 24, 35, 46
This raises the question: was it just a strange coincidence or is there something more at play here? The betting slip may hold a clue—the combination just so happened to form a diagonal line on the ticket.
1, 2, 13, 24, 35, 46.
So, out of the 5.1 million people who participated in the Bonoloto draw, ten of them decided to get creative and draw a diagonal line on their betting slips. And wouldn’t you know it, they ended up splitting the jackpot of €670,000, receiving only €67,000 each. It just goes to show that trying to be unique can sometimes make you unoriginal. Who knows how many other people participate in the lottery with their own creative twists—lines of all kinds, little clusters, smiley faces, geometric shapes… the possibilities are endless!
Boundless inspiration!
The moral of the story: if you want to stand out, be as random as possible!
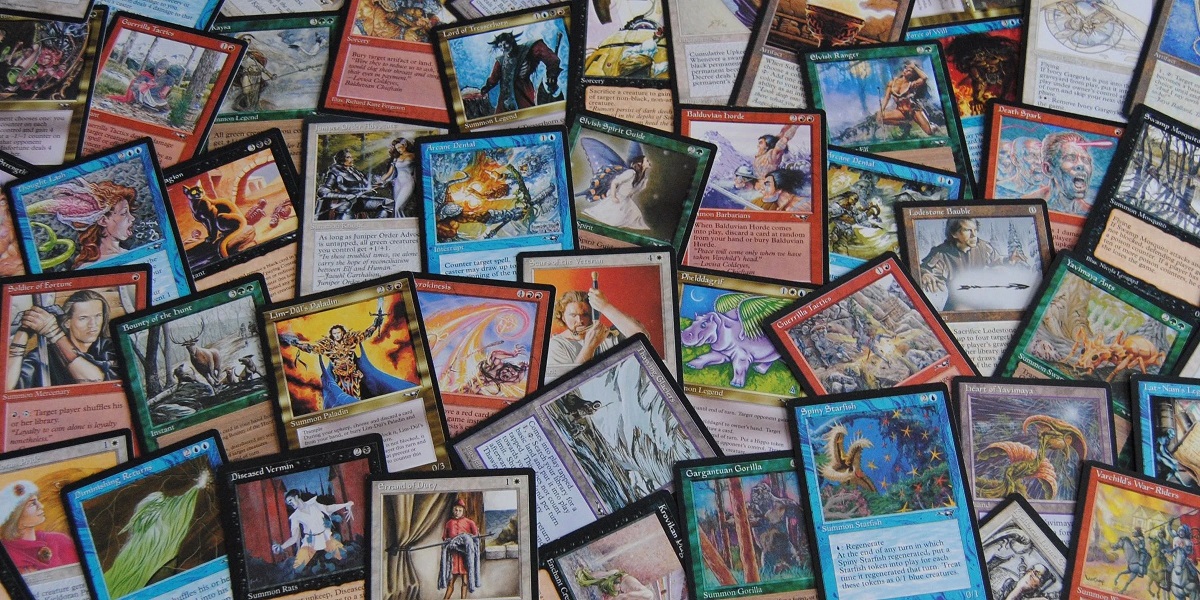
]]>The science behind ‘Magic: The Gathering’2021-08-02T00:00:00+00:002021-08-02T00:00:00+00:00/2021/08/02/science-behind-mtgMagic: The Gathering (MTG) is a funny trading card game inspired by fantasy role-playing games. MTG emulates a combat between players’ creatures, where not only their strength matters but also their abilities. Everything revolves around magic, which is present in the form of enchantments, artifacts, sorceries and many other exciting spells. There is a huge variety of creatures (and other spells) with which to compose your deck, roughly organized in five colors:
white for angels, clerics and spells that evoke life;
black for demons, vampires and other deadly spells;
red for goblins, dragons, fire and explosions;
green for elves and wild forest creatures;
and blue for aquatic monsters and psychic spells.
Uncolored and multi-colored cards also exist. And cats, many kinds of cats. The catalog is really huge, continually expanding since 1993 and can be consulted on Gatherer, the MTG card database.
Old MTG cards.
MTG, however, has a steep learning curve that makes it hard to understand at first. The complexity of its rules may be discouraging (each card has its own instructions!) and, to top it off, it’s often considered a game for nerds. If, despite that, you want to learn how to play, I recommend the computer version, MTG Arena, which is freemium, fully playable and has an excellent tutorial.
Turing completeness of MTG
It has recently been (Churchill et al.) stated that MTG is Turing-complete. A system is Turing-complete when it can be used to simulate any Turing machine. Or, in other words, a Turing-complete system can solve any computational algorithm. So, MTG can be used to program things!
But let’s take it step by step. Turing machines, proposed by the mathematician Alan Turing in 1936, are a class of automata able to take a program, run that program and show some result. A Turing machine is made up by four components:
an infinite one-dimensional tape divided into squares;
a finite instruction table that tells what to do with each combination of scanner state and tape symbols.
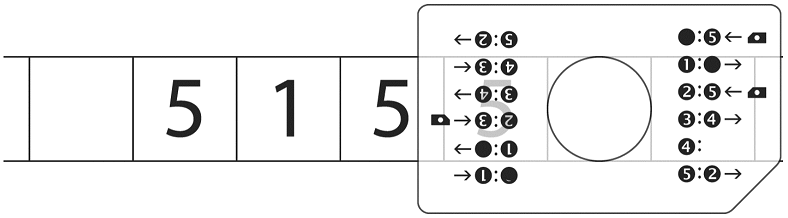
In the article that can be found here, a Turing machine is represented in a very original way as a business card. This business card has a hole in the center (the tape scanner) through which only one symbol written on the tape can be seen. The states of the tape scanner are represented by the four possible ways of orienting the card on the tape. Each orientation allows a different instruction table to be properly interpreted.
Image extracted from ‘A Business Card Universal Turing Machine’ by A. R. Smith.
Whatever way it is represented, this is how it works: the machine positions its tape scanner over a square on the tape and reads the symbol written on it. Then, based on the symbol read and the state of the tape scanner, the machine looks in the instruction table for
which new symbol to write in the square;
whether to move the tape one square to the left or to the right; and
whether to change the scanner state or stop (halt) the process.
If the process has not halted, the tape scanner reads the current square and so on.
With these simple rules it is possible to run any conceivable algorithm. However, the instruction table may not necessarily be easy to find, and the number of steps required to reach a result may not necessarily be small.
This website illustrates step by step how some Turing machines compute simple operations between numbers. For example, they use a 2-symbol, 17-state machine to solve products of two integers represented by the unary numeral system (in which 5 is 11111). Solving 3 x 4 requires 261 steps! Not so cool, considering that you have to count the twelve 1s to know the result.
The prove
To prove that a programming language, device or system is Turing-complete all you have to do is to show that it can be used to implement a universal Turing machine (UTM). That is, that it can simulate the behavior of any other Turing machine.
In general, a system that has a control flow that allows conditionals and loops, and has something that works as a memory is usually Turing-complete. All general-purpose programming languages such as C, Python or Java are Turing-complete. But accidentally, there are other systems that are also Turing-complete if you force them a little. This is the case of the zero-person game of life, the videogames Minecraft and Cities: Skylines, and even Microsoft Office PowerPoint, to mention a few.
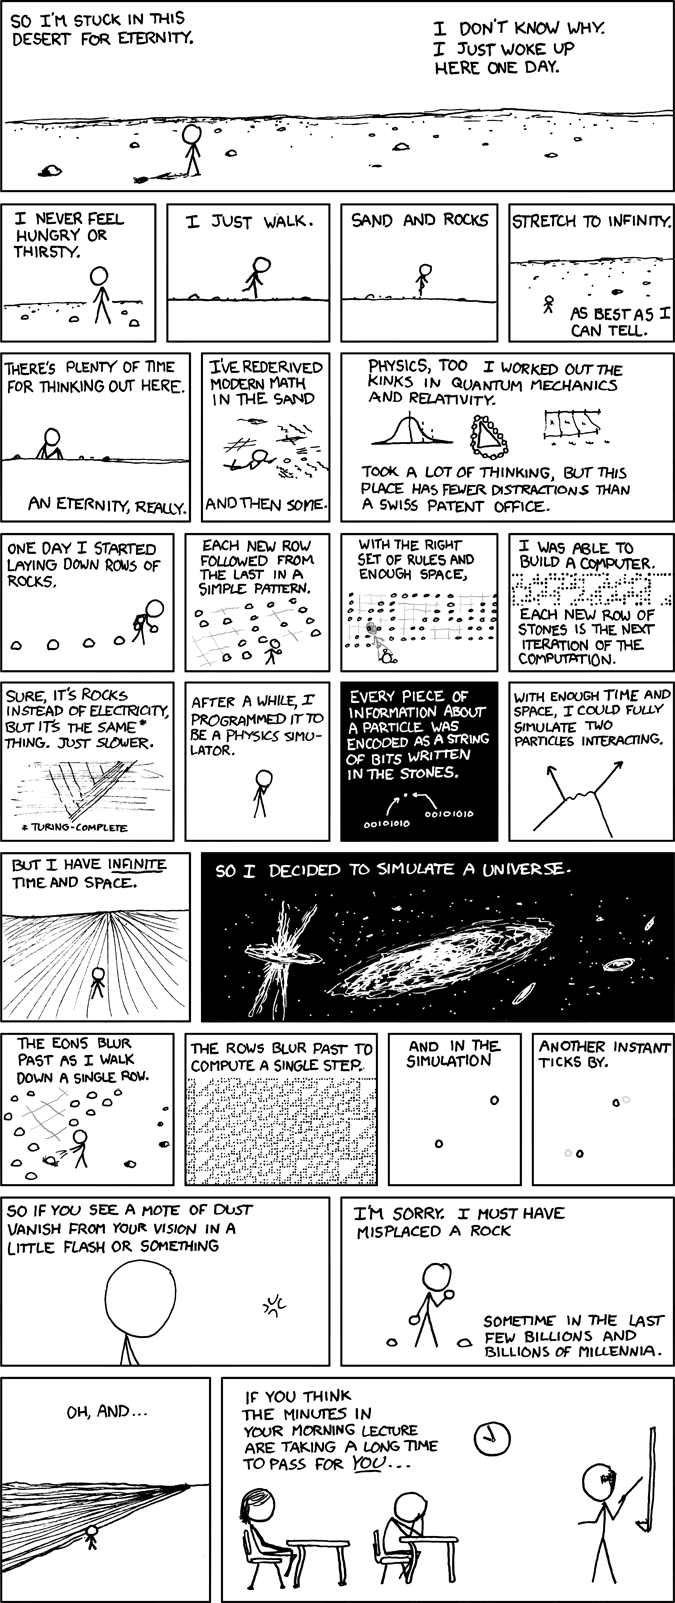
In the following XKCD comic strip, the starring sticksman creates a UTM only with rows of stones.
A bunch of rocks, by XKCD.
A set of very small UTMs exists that are Turing-complete. Among them are the ones found by Yurii Rogozhin in his paper Small universal Turing machines (1996). The simplest known one, the Rogozhin UTM(4, 6) has, as its name suggests, 4 states and 6 symbols, and its instruction table is made up of 22 instructions. Other Rogozhin UTMs are UTM(15, 2), UTM(9, 3), UTM(6, 4), UTM(5, 5), UTM(3, 9), and UTM(2, 18). If you can embed one of these in your system, you’ve got it: it’s Turing-complete!
What about MTG?
Churchill et al. embed the Rogozhin UTM(2, 18) in MTG. How they achieve this is very complex and requires a fairly high level of knowledge of MTG mechanics, but some key points are as follows.
The tape is emulated by means of creature tokens. The power/hardness values of the creature tokens represent their position relative to the tape scanner, which is centered at 2/2. The color of the creatures represents whether the tape moves to the left (green) or to the right (white).
The 18 symbols of the Turing machine are represented using 18 creature types: (1) Aetherborn, (2) Basilisk, (3) Cephalid, (4) Demon, (5) Elf, (6) Faerie, (7) Giant, (8) Harpy, (9) Illusion, (10) Juggernaut, (11) Kavu, (12) Leviathan, (13) Myr, (14) Noggle, (15) Orc, (16) Pegasus, (17) Rhino, and (18) Sliver. For example, a white 6/6 Kavu creature indicates that the 11th symbol is written on the 4th square to the right of the tape scanner.
Certain cards, such as Rotlung Reanimator (creates 2/2 black Zombie creature tokens), Artificial Evolution (replaces the creature type), and Glamerdye (replaces the creature color), are used to generate the creature that is needed at any time. This allows the instruction table to be fully implemented.
Similarly, Cloak of Invisibility allows creatures to be phased in and phased out, which makes it possible to implement the two states of the machine. In addition, other cards are required for other relevant purposes, such as halting the device, changing states, generating unlimited mana, and so on.
The following video explains the whole process in more detail:
Some final remarks
In a normal game you cannot arbitrarily play the cards you want. Indeed, you must prepare a deck of 60 cards and randomly draw a starting hand of 7 cards. However, Churchill et al. propose in their paper a sequence of cards to start with that is very unlikely to appear randomly in an initial hand. There are other weaknesses, such as all the time and space it would take to manually run the Turing machine with the MTG cards.
The exercise of embedding a universal Turing machine in Magic: The Gathering is a very original theoretical work (that I admire) but, from my point of view, it’s hardly transferable in a real game.
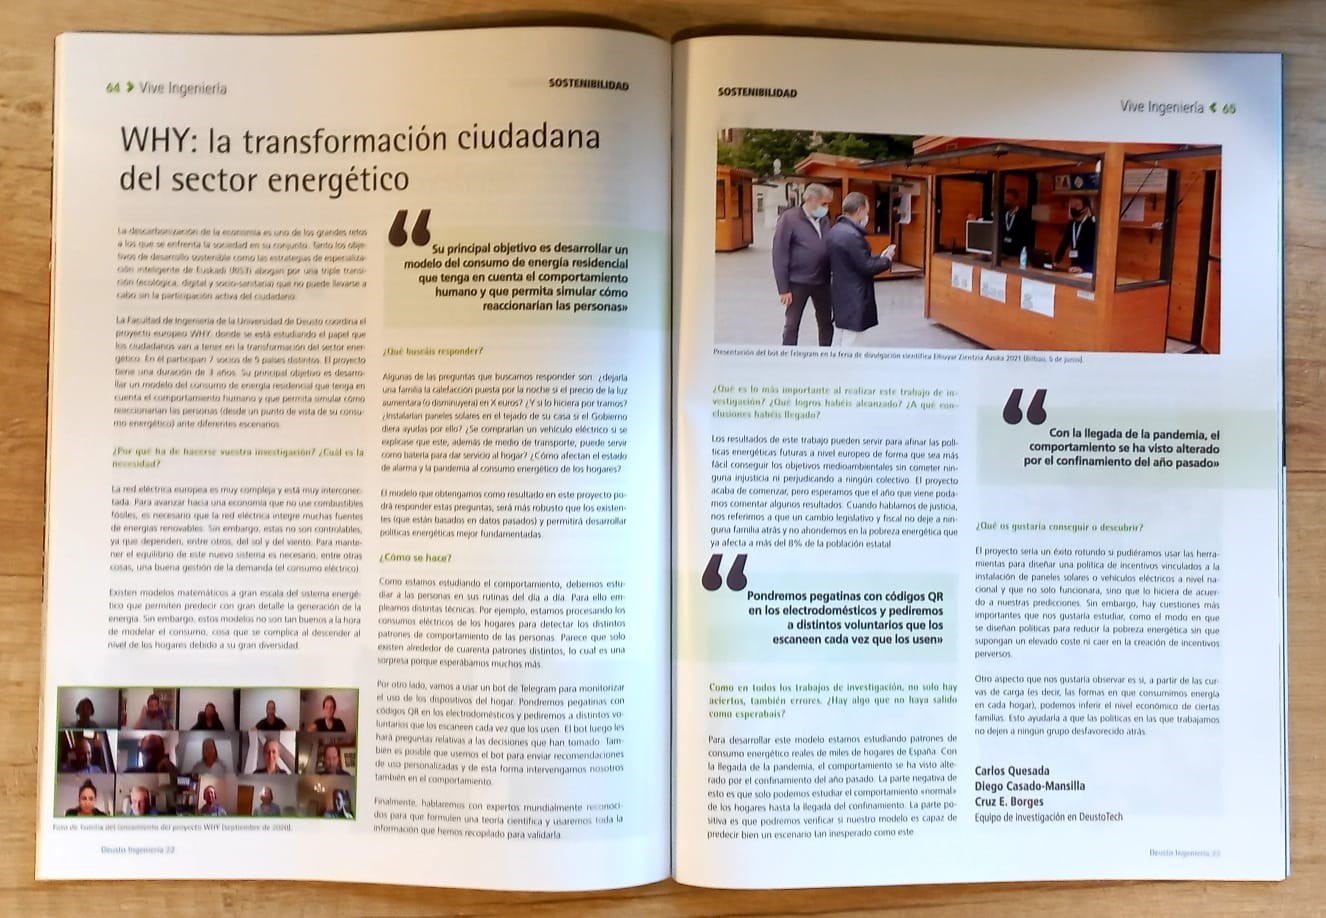
Original journal showing the pages of our article.
One of the major challenges facing society as a whole is the decarbonisation of the economy. Both the sustainable development objectives and the intelligent specialisation strategies of the Basque Country (RIS3) support a triple transition (environmental, digital and social), which cannot be achieved without the active participation of citizens.
The Faculty of Engineering of the University of Deusto is coordinating the European WHY project, which examines the role that citizens will play in the transformation of the energy sector. It involves seven partners from five different countries. The project will last three years. Its main objective is to develop a model of residential energy consumption that takes into account human behaviour and makes it possible to simulate how people would react to different scenarios in terms of their energy consumption.
Why does your research need to be done? What is the need?
The European electricity grid is very complex and highly interconnected. In order to move towards a non-fossil fuel economy, the electricity grid needs to integrate many renewable energy sources. However, these are not controllable as they depend on the sun and wind, among other things. In order to maintain the balance of this new system, it is necessary, among other things, to manage demand (i.e. electricity consumption).
There are large-scale mathematical models of the energy system that can predict energy production in great detail. However, these models are not as good at modelling consumption, which becomes more difficult when you get down to the household level because of the great diversity of households.
What do you aim to answer?
Some of the questions we want to answer are: Would a family leave the heating on at night if the price of electricity rose (or fell) by X euros? Would they install solar panels on the roof of their house if the government offered subsidies? Would they buy an electric car if it was explained that it could be used not only as a means of transport but also as a battery to power the home? How will the state of alert and the pandemic affect household energy consumption?
The model that will emerge from this project will be able to answer these questions, will be more robust than existing models (which are based on historical data) and will allow better informed energy policies to be developed.
How is this done?
Because we study behaviour, we need to study people in their daily routines. We use different techniques to do this. For example, we process household electricity consumption to identify the different patterns of people’s behaviour. It seems that there are only about forty different patterns, which is surprising because we expected many more.
On the other hand, we will use a Telegram bot to monitor the use of household appliances. We will put stickers with QR codes on household appliances and ask volunteers to scan them every time they use them. The bot will then ask them questions about the choices they have made. It is also possible that we will use the bot to send personalised usage recommendations, so that we can also intervene in behaviour.
Finally, we will talk to world-renowned experts to formulate a scientific theory and use all the information we have gathered to validate it.
What is the most important aspect of this research work? What have you achieved? What conclusions have you reached?
The results of this work can be used to fine-tune future energy policies at the European level in a way that makes it easier to achieve environmental goals without doing injustice or disadvantaging any groups. The project has only just begun, but we hope to be able to comment on some of the results next year. When we talk about justice, we mean that a legislative and fiscal change will not leave any family behind and will not deepen the energy poverty that already affects more than 8% of the country’s population.
As in all research work, there are not only successes, but also mistakes. Is there anything that has not turned out as you expected?
To develop this model, we are studying the real energy consumption patterns of thousands of households in Spain. With the arrival of the pandemic, behaviour has been changed by last year’s lockdown. The disadvantage of this is that we can only study the ‘normal’ behaviour of households until the arrival of the containment. On the positive side, we will be able to test whether our model is good at predicting such an unexpected scenario.
What would you like to achieve or discover?
The project would be a huge success if we could use the tools to design an incentive policy linked to the installation of solar panels or electric vehicles at a national level that not only works, but works according to our predictions. But there are more important issues that we would like to look at, such as how to design policies that reduce fuel poverty without being costly and without creating perverse incentives.
Another aspect we would like to look at is whether we can infer the economic status of particular households from load curves (i.e. the way we use energy in each household). This would help to ensure that the policies we are working on do not leave vulnerable groups behind.
]]>Benford’s law and the 2021 Madrid regional election2021-05-08T00:00:00+00:002021-05-08T00:00:00+00:00/2021/05/08/benfords-law-madridI originally wanted the title of this post to be “Was the 2021 Madrid regional election fraudulent?”, but I found it too much for a post about observation-based laws and R code.
In particular, this post focuses on Benford’s Law. This law describes a phenomenon by which, in many real-life collections of numbers, those numbers whose leading digit is 1 appear more frequently than numbers beginning with other digits. Some examples of these collections of numbers include
the number of followers of Twitter users,
the number of books in US libraries,
the population of Spanish cities,
the street numbers of Brazilian addresses, and so on.
In all these collections, the digit that most of the numbers start with is 1, then 2, then 3… and so on, with 9 being the digit that the fewest numbers start with.
The website testingbenfordslaw.com provides a visual check of these examples and many more.
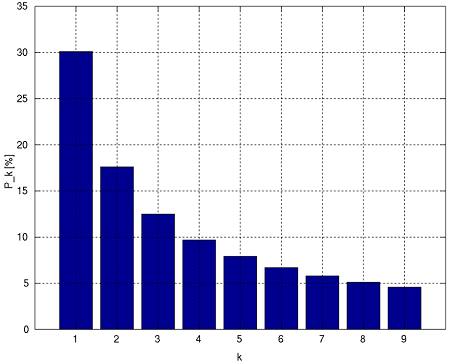
The distribution of the first digits, according to Benford's law. Image from Wikipedia.
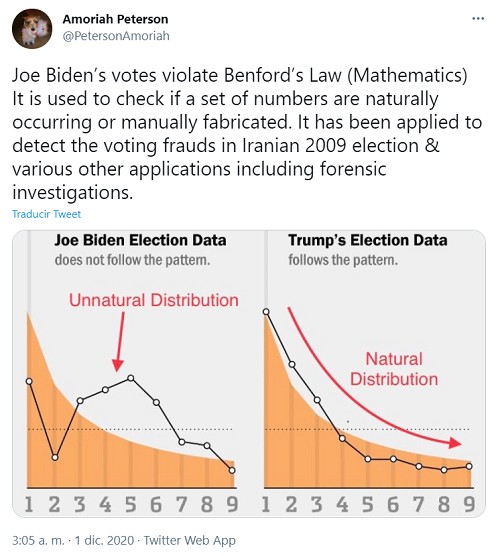
This law, which might seem not so relevant, has interesting applications in the fields of forensic accounting, auditing and fraud detection, as described in the book by M. J. Nigrini, Benford’s law. Among the frauds that are often analyzed with Benford’s law are tax fraud and also electoral fraud. For example, a claim that circulated on social media after the 2020 US Presidential election was that some of the votes for Joe Biden seemed suspicious because they did not follow Benford’s law. The tweet below is an example.
Tweet by @PetersonAmoriah
Last Tuesday (May 4th) there were regional elections in Madrid and I wanted to check whether Benford’s law holds true for the results of each municipality in the region. Six main political parties contested the 136 seats in the Madrid Assembly and the results were as follows:
Partido Popular: 65 seats (1,620,213 votes)
Más Madrid: 24 seats (614,660 votes)
PSOE: 24 seats (610,190 votes)
Vox: 13 seats (330,660 votes)
Podemos: 10 seats (261,010 votes)
Ciudadanos: 0 seats (129,216 votes)
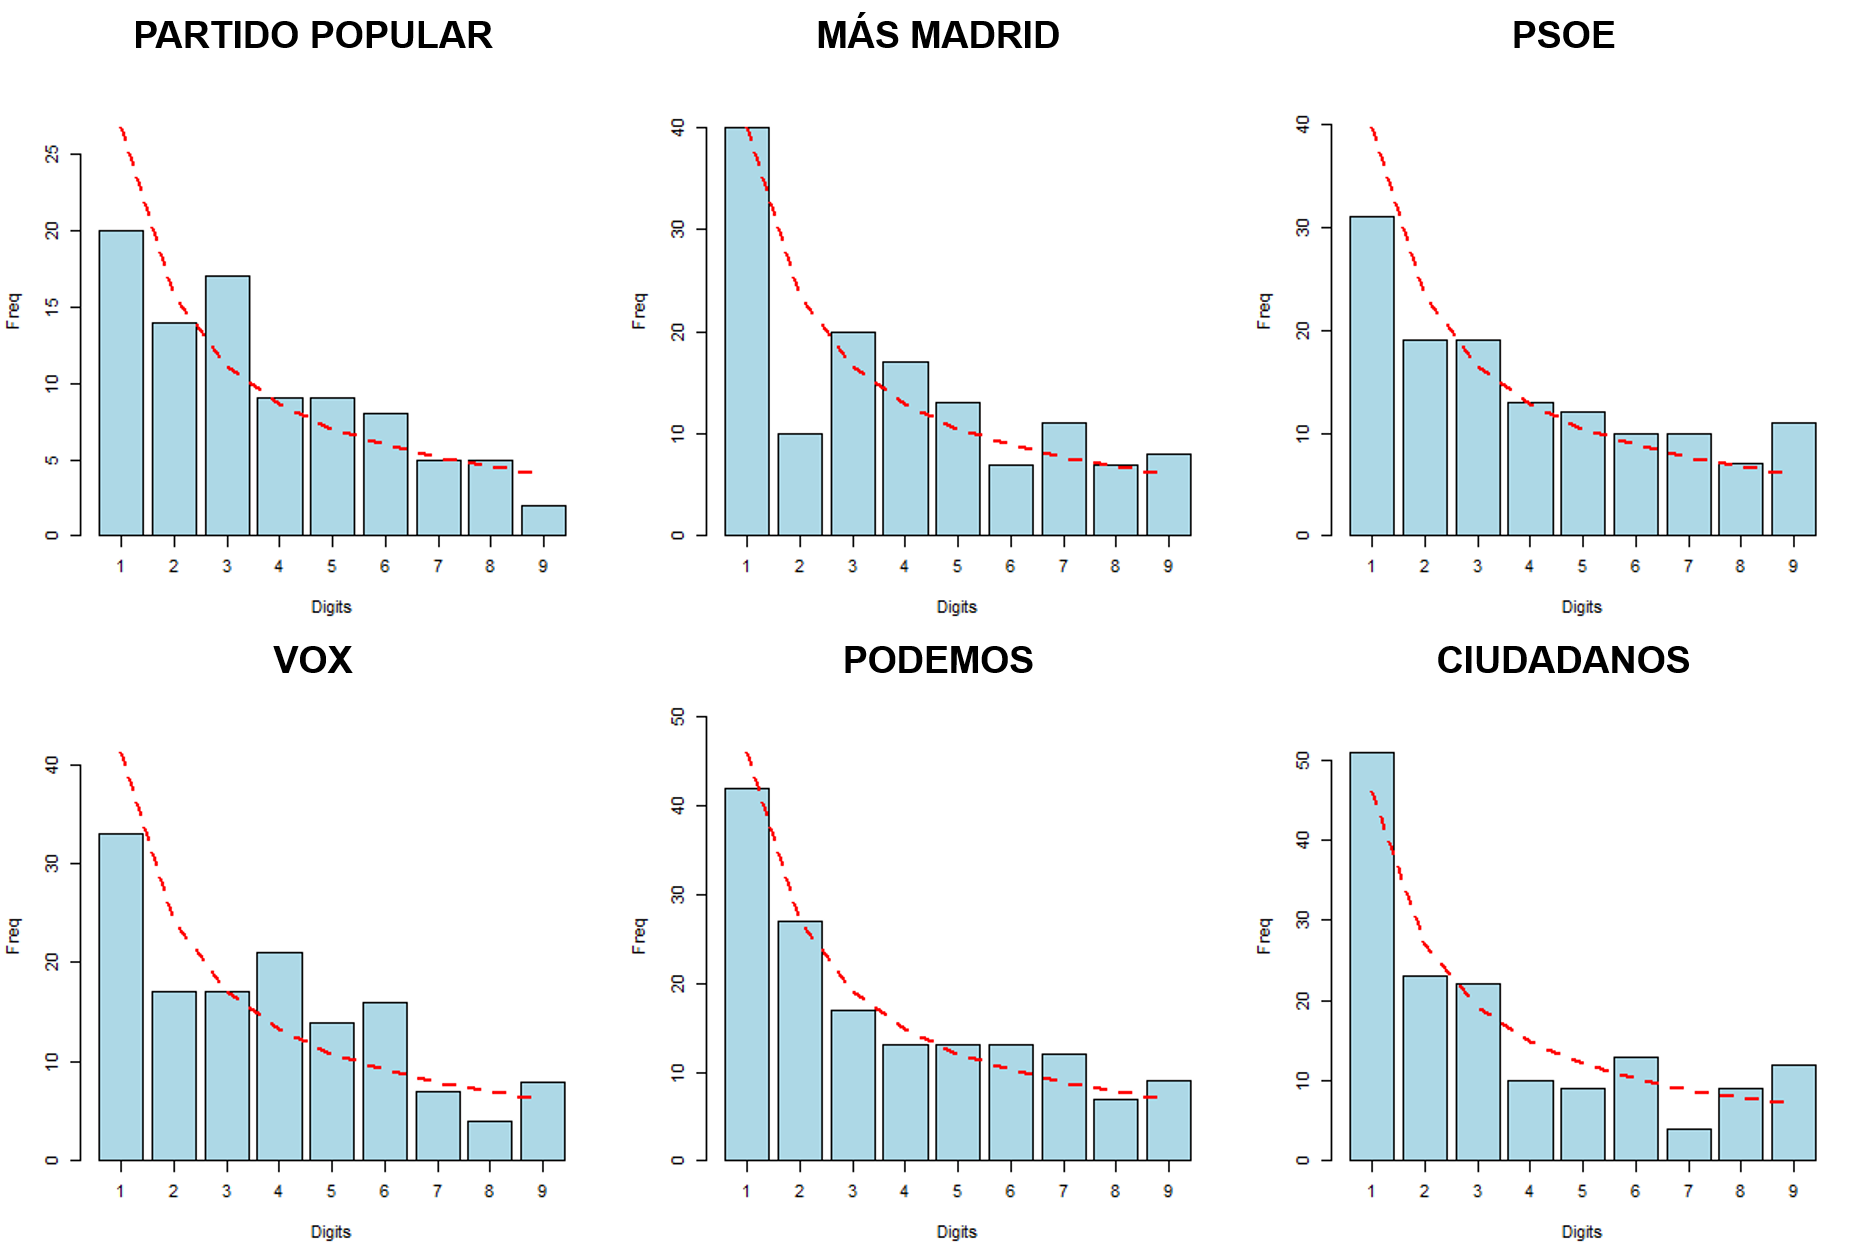
The results per municipality and per polling station can be found at the official site of the elections. To make things easier though, I have created two CSV files from this data, which can be found in my GitHub repository. In addition, to analyze the data using Benford’s law, I have prepared a very simple piece of code in R that makes use of the benford.analysis package. The script, which can also be found in my repository, represents a histogram with the leading digits of the electoral results for each municipality of Madrid, and compares it with the ideal curve according to Benford’s law. The results are shown below for each of the six main parties:
The blue bars show the real distribution of leading digits, whereas the red curve shows the ideal distribution following Benford's law.
As can be seen, none of the histograms perfectly meet expectations. The same happens when polling station data is used instead of municipality data. Does this mean that the elections were rigged? I don’t think so, because the election result was very close to what most polls predicted weeks ago. So, what’s happening here?
The answer may be complex, but it seems that Benford’s law is not as good at detecting electoral fraud as it was thought to be. In a paper published in 2017, J. Deckert et al. designed a series of simulations to model both fair and fraudulent elections, and they found that “conformity with and deviations from Benford’s law follow no pattern”. Indeed, they stated that finding patterns using Benford’s law when it comes to elections is similar to “seeing cats, dogs, and crows in clouds”. So, bookmark this paper for the next time someone proves electoral irregularities using Benford’s law!
]]>My postdoc at Université de Technologie de Compiègne2020-12-21T00:00:00+00:002020-12-21T00:00:00+00:00/2020/12/21/my-postdoc-utcIn this post, I will share with you the results of the research I conducted during my postdoctoral position at the Université de Technologie de Compiègne in France, which took place from January 2017 to July 2018.
My research focused on microcapsules, which are micrometer-sized liquid droplets enclosed by a thin elastic membrane. These microcapsules have potential for use in medicine as controlled drug delivery vehicles. The deformation of microcapsules as they flow through microfluidic channels plays a crucial role in determining their behavior and effectiveness.
In the following three sections, I will present the main findings of the three main studies I published on this topic. These studies are presented in the form of blog posts that I wrote when each of the papers was published.
Published my article on microcapsule shape prediction!
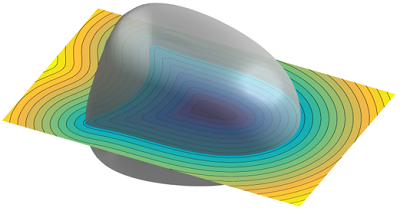
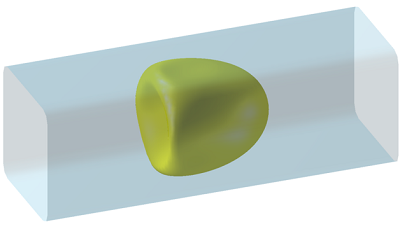
A microcapsule is a micrometric liquid droplet enclosed by a thin elastic membrane. In nature, they appear in the form of red blood cells, vesicles or eggs. However, they can be artificially created to protect substances inside, such as drugs or aromas, and release them in a controlled way through their rupture. When capsules are suspended in a microfluidic channel, they undergo large deformations, which are tremendously time-consuming to compute. Predicting these deformations is crucial to determine if and when capsules will break.
Rendered image of a microcapsule flowing through a channel (not depicted). The color map indicates the distance to the center of the microcapsule.
Capsule in a microchannel
Image of a capsule flowing through a square-section microchannel from left to right.
In this article we designed a series of strategies to accelerate the calculation of the deformation of microcapsules based on dimensionality reduction. In particular, we chose the Proper Orthogonal Decomposition (POD) to obtain the principal components of the shapes of around one hundred deformed capsules from previous simulations. Using the principal components, we obtained a hypersurface of solutions as a function of the parameters of the microfluidic channel. In order to walk around the hypersurface, and thus predict the shape of the capsule for unknown values of the parameters, we analyzed different approaches.
We found that the diffuse approximation, a method developed at UTC similar to the Locally-Linear Embedding (LLE), provided excellent predictions. As a result, we succeeded in moving from complex simulations that took several days of computation to approximations with minimal error that required only a few seconds. This represents an amazing gain in time of around 8,600,000%!
Published my second article on microcapsules!
This post was published on January 24, 2021
A month ago, on Christmas Day, the second (and last) of the articles I wrote during my stay at the Université de Technologie de Compiègne (UTC) was published online. What a cool Christmas present! The article is entitled Diffuse approximation for identification of the mechanical properties of microcapsules and can be found in the journal Mathematics and Mechanics of Solids.
As I already mentioned in my last post, a microcapsule is a liquid droplet enclosed by a thin elastic membrane that can be used to release substances in a controlled manner. Microcapsules have a promising future in the field of medicine. Just imagine a medication made up of thousands of these microcapsules filled with drug. By controlling the moment of rupture, it would be possible to release the drug in any target organ!
Image of a capsule flowing through a square-section microchannel from left to right.
When microcapsules flow inside a microfluidic channel, they undergo large deformations that modify their shape or even cause their rupture. So it is essential to determine the mechanical properties that define the behavior of microcapsules. In particular, there are three parameters that characterize a microcapsule mechanically: the capsule-to-tube confinement ratio, the capillary number (which measures the viscosity-to-surface tension ratio), and the velocity ratio. The objective of this paper is to determine these three parameters from the shape of a flowing microcapsule observed in a snapshot.
Since the amount of images of flowing capsules labeled with their corresponding parameters was really low (we had just a few), the idea of using convolutional neural networks to perform an automatic identification was initially discarded. Instead, we computed several simulations of microcapsules and measured certain geometric values from them (basically end-to-end distances), as we would have done experimentally. Then, we applied a technique based on diffuse approximation to map from the measured geometric values to the required mechanical parameters. As a result, the identification provided low errors over a wide range of values of the estimated parameters! This opens interesting perspectives for applications that require a tight control of the microcapsule mechanical properties.
Published a third article on microcapsules!
This post was published on September 9, 2021
The work that I carried out during my stay at the Université de Technologie de Compiègne, focused on the dimensionality reduction of a model of microcapsule deformation, continues to bear fruit three years later. The journal Entropy has published the paper entitled A Data-Driven Space-Time-Parameter Reduced-Order Model with Manifold Learning for Coupled Problems: Application to Deformable Capsules Flowing in Microchannels, of which I am one of the authors. This is therefore the third paper on microcapsules I got published! The paper proposes a dimensionality reduction technique to model suspensions of microcapsules, that is, microdrops protected in a thin hyperelastic membrane, which are used in healthcare as drug vehicles.
]]>Scope of variables in R2020-12-13T00:00:00+00:002020-12-13T00:00:00+00:00/2020/12/13/scope-variables-rOne of the things I liked the least about R when I was learning to program in it was the scope of variables. Its behavior is substantially different from that of other more popular languages and can cause code errors very easily if one doesn’t know how it works.
Let’s see a simple example.
y <- 3
f <- function(x) {
  x + y
}
Although the y variable hasn’t been defined within the environment of the f function, this program runs correctly.
> f(2)
[1] 5
This is because R uses a lexical scope to find the value associated with a variable. That is, if R doesn’t find the value of the variable within the function, it will look for it outside, in the environment where the function was defined. This behavior is counter-intuitive for regular C, Python or Matlab programmers, and can be a major source of bugs.
R bugs crawling into your code.
When I discovered this feature, I was developing several functions with many input parameters to be called from a different function. By doing this, my first impression was that I was wasting my time. Because, what’s the point in defining input parameters in R functions? There’s no real need to have functions with input parameters! All you have to do is assign the function’s internal variables before calling the function, and R will do the rest.
Of course, this is not at all elegant and generates a hard-to-read code. While this might work for small files being very careful, it would be unmanageable for large projects.
The best way to bypass the problems generated by the scope of variables in R is to create a package, splitting the functions into different files. In addition, when compiling the package, functions that are not properly defined can be detected with commands like devtools::check().
]]>Domestication of the fox2019-02-10T00:00:00+00:002019-02-10T00:00:00+00:00/2019/02/10/domestication-foxThis post is an old article (originally in Spanish) I wrote in 2019 on Blogger.
Domesticated animals present a series of changes in their morphology, physiology and behavior with respect to their wild variants. For example, in the case of the dog (as opposed to the wolf), some researchers have identified the existence of pedomorphosis, that is, the preservation of juvenile traits in adult individuals. Some of these traits, which do not occur in adult wolves, range from the shape of the skull, which is unusually wide for its length, to communication through whining, barking and submission. Other domesticated animals have undergone changes in size, coat color and even their reproductive cycle.
For Russian geneticist Dmitry Belyayev (1917-1985), the factor that determines these changes in domesticated animals is their behavior and, in particular, their predisposition to tameness. To test his hypothesis, Belyayev reproduced the domestication process in an animal that had never been domesticated before. The aim was to observe whether or not these changes occurred. As an experimental model, he chose a species taxonomically close to the dog, the fox (Vulpes vulpes), and designed a selective breeding program focused on selecting the tamest individuals. Belyayev began his experiment in 1959 with 100 female and 30 male silver foxes (with dark fur) selected from several Estonian fur farms.
Silver fox specimen, characterized by the dark shade of its fur.
The foxes of this first generation were already tamer than their wild relatives because they were born in cages. To ensure that tameness was only the result of genetic selection, foxes were not trained. Tameness was evaluated by means of a series of tests that allowed the foxes to be classified into three classes. The least tame foxes, that is those that ran away or bit the experimenters when they were petted, were assigned to class III. Foxes that allowed themselves to be petted and handled, but did not show a friendly response to the experimenters, were placed in class II. Finally, foxes that were friendly and wagged their tails at humans were included in class I.
Only Class I foxes continued in the selection. From the sixth generation on, it was necessary to add a higher category: the class IE or the “domesticated elite”. Class IE foxes were impatient to establish contact with humans, even whining to attract attention and sniffing and licking the experimenters as if they were dogs. And all this before they were a month old. In the sixth generation, only 1.8% of the pups belonged to the IE class. But over the course of the experiment, this figure rose to 18% in generation 10, 35% in generation 20 and 49% in generation 30, reaching 70% in 2004.
Foxes in the domesticated population showed an unusually high incidence of changes in some aspects of their morphology. The first change to become apparent was the fur color: some foxes showed a loss of pigmentation in some areas of the body that could even form a star-shaped pattern on the face, similar to that of some dog breeds. Later, other peculiarities have been documented, such as drooping ears and curled tails. In addition, after 15 to 20 generations, foxes with shorter tails, shorter legs and dental malocclusion (misalignment between upper and lower teeth) appeared.
Thus, this experiment has shown that many characteristics developed by dogs during their evolutionary course towards domestication can be reproduced, in a few tens of generations, by a strong selective pressure focused on specific behaviors.
]]>Apollo 13’s radioactive secret2017-08-27T00:00:00+00:002017-08-27T00:00:00+00:00/2017/08/27/apollo13-radioactive-secretThis post is an old article I wrote in 2017 on Medium.
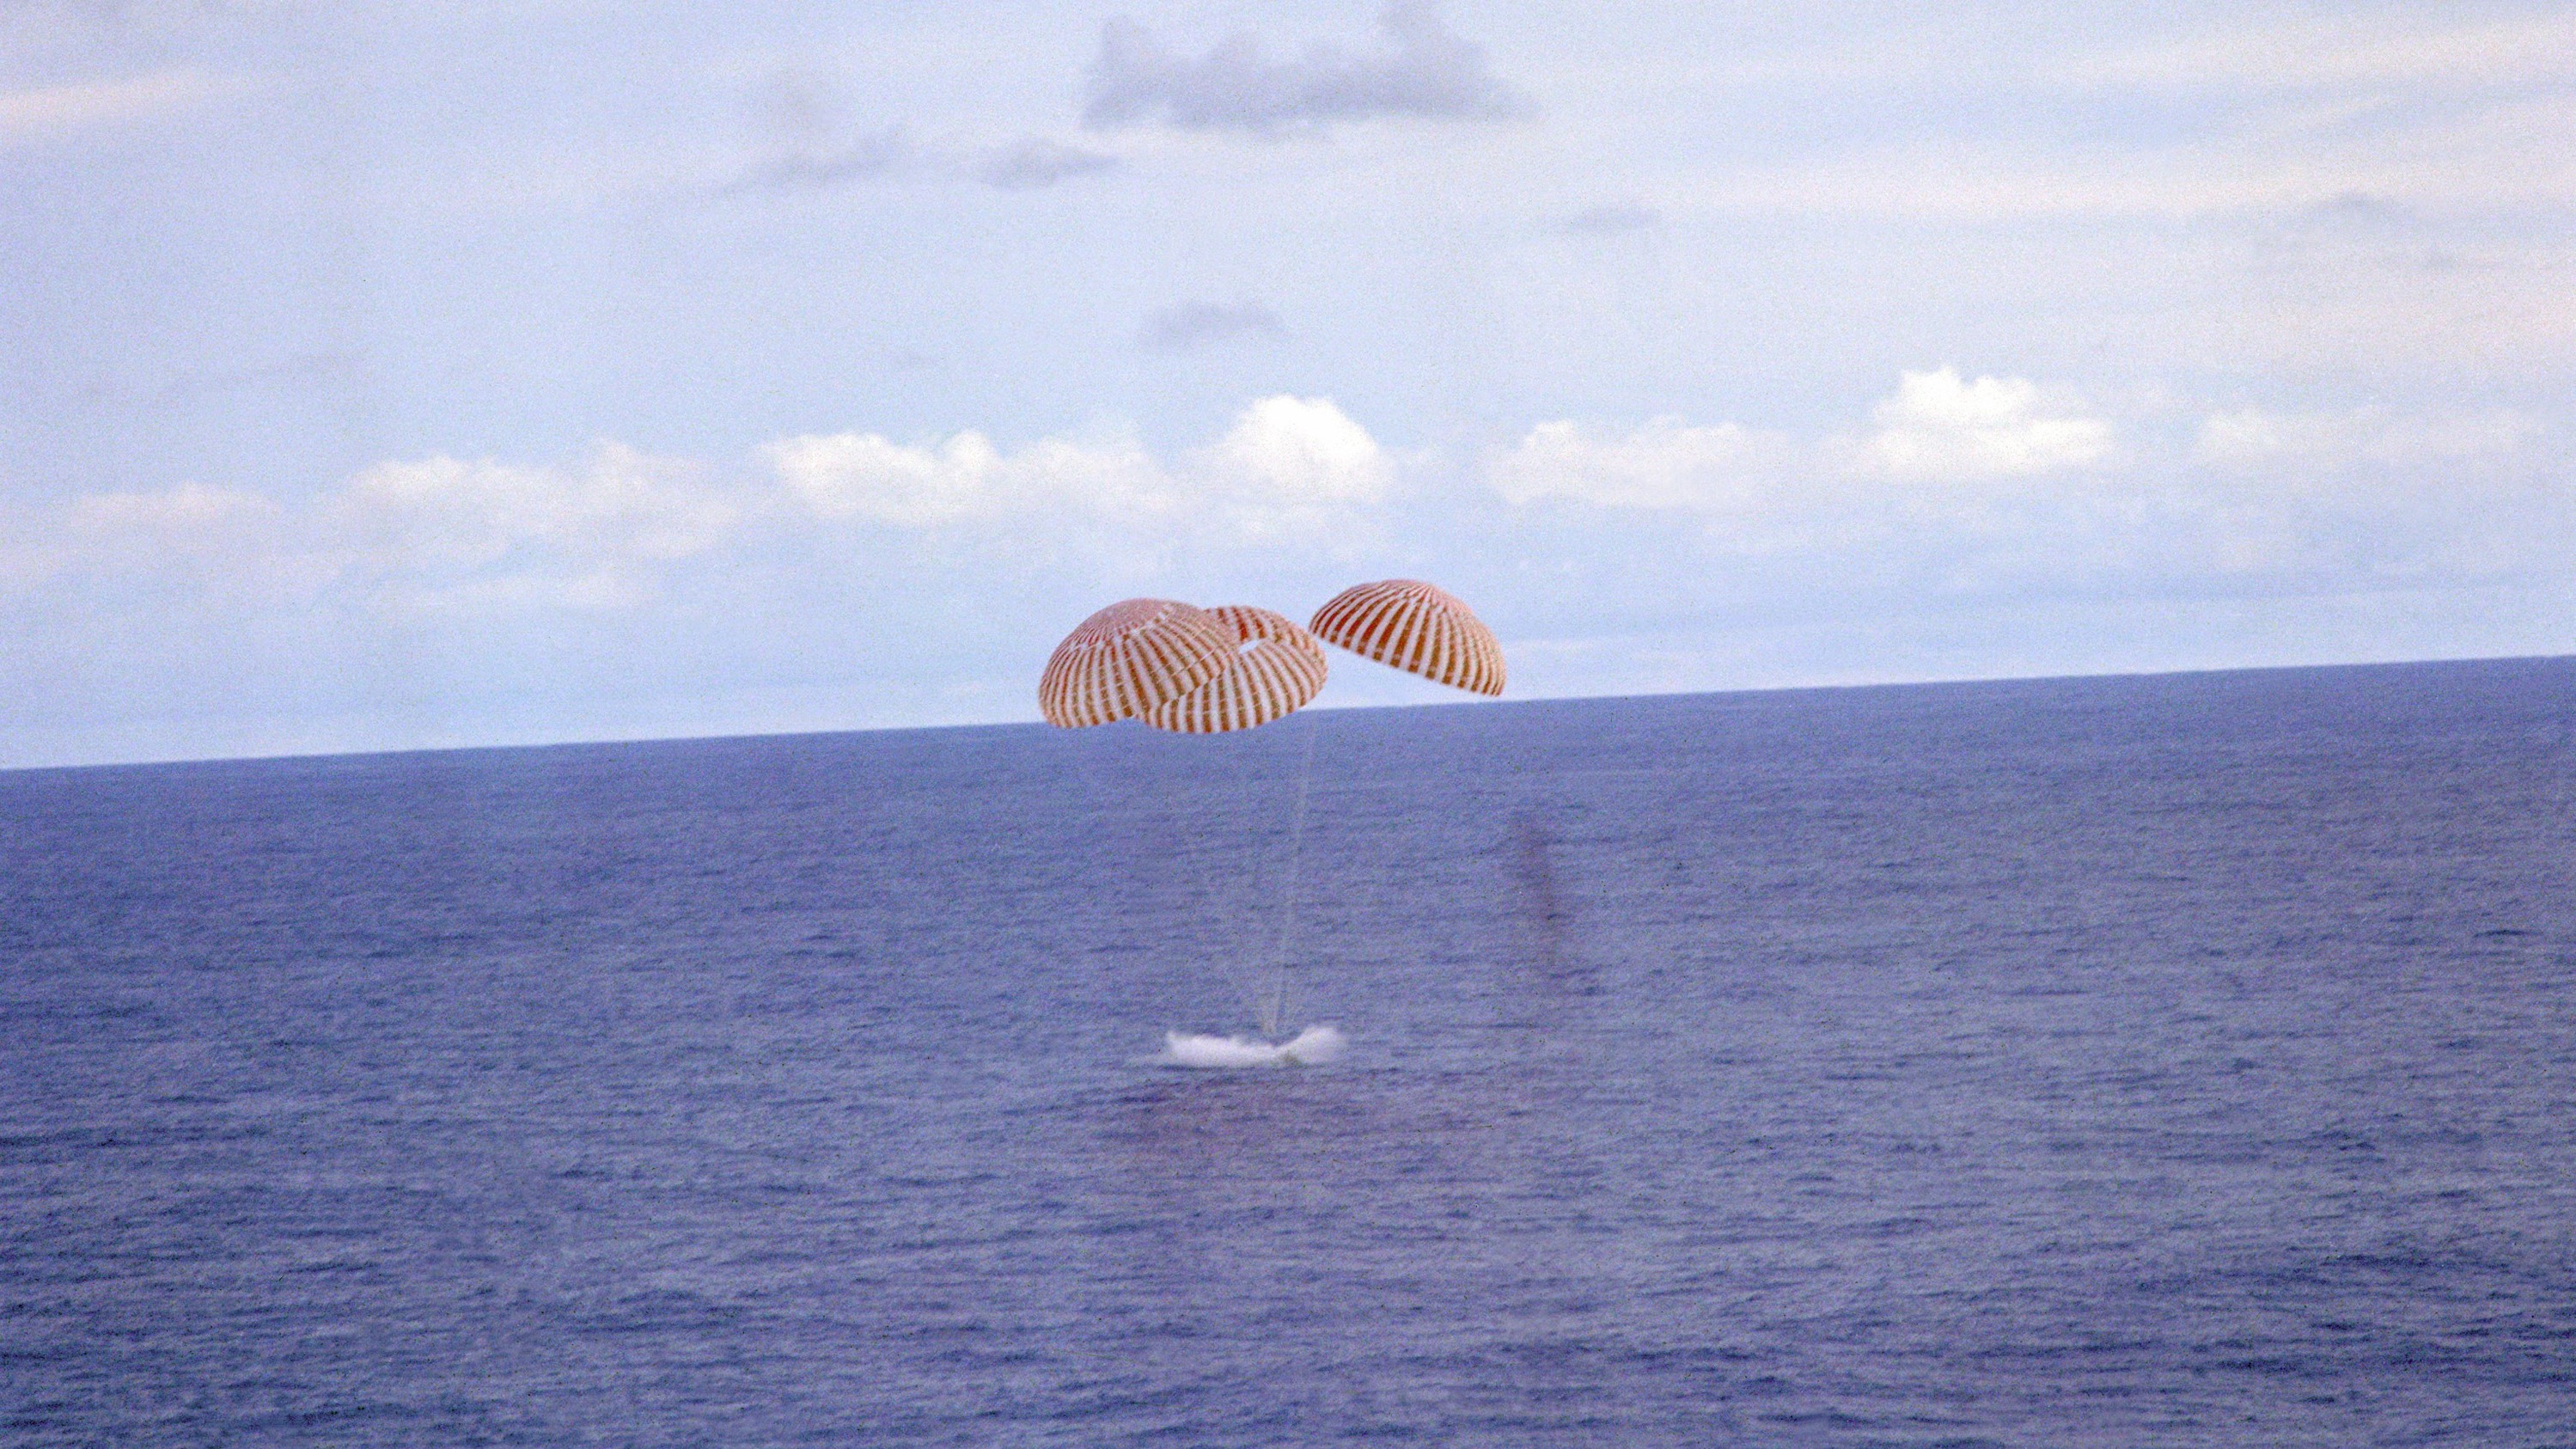
On April 11, 1970, NASA launched the Apollo 13 manned spacecraft with the intention of landing for the third time on the Moon. Halfway, during the second day of travel, an oxygen tank of the spacecraft burst and destroyed a couple of modules. The three crew members struggled to survive in the half-destroyed ship. After five very complicated days, they were able to return safely back to Earth —or not so safely, since one of them got a urine infection due to holding his pee for too long.
Moment in which Apollo 13 splashed down.
This is not an unknown story. On the contrary, Hollywood already monetized it in 1995, with the Oscar-nominated movie Apollo 13. This article, however, is not about how skillful and lucky the crew was, but about the little present that the Lunar Module (a part of the Apollo 13 that also went back to the Earth) left in the Pacific ocean when it sank.
In order for the artifacts that are sent to the space to work, it is necessary to equip them with a powerful source of energy. One of the most attractive ones, because of its duration and lack of maintenance, is the radioisotope thermoelectric generator (RTG), a device that generates electricity (a few hundred watts) from a source of heat, particularly coming from the nuclear disintegration of radioactive atoms. In short, an RTG is like a small nuclear power station in the form of a very large car battery.
At first glance, RTGs are presented as a very good solution to the energy problem: they are maintenance-free electricity generators that last for many years and are not very expensive. For instance, some of the scientific instruments carried by the Voyager probes, which were launched 40 years ago to study the gaseous planets of our solar system and are currently drifting somewhere in interstellar space, still work thanks to the energy provided by their RTGs, and will continue working for 10 or 15 more years.
It is not necessary to go the outer space to find the practical value of those batteries. Soviet Russia put several RTGs into the most inaccessible lighthouses in the Arctic so that they could operate autonomously and seamlessly for some decades, and they are currently forgotten and under poor maintenance conditions.
However, we have all seen on TV launch failures of spaceships that explode before leaving the atmosphere. When this occurs, what happens to the RTGs? It is obvious: they become a disastrous cloud of highly radioactive waste. And it has already happened several times.
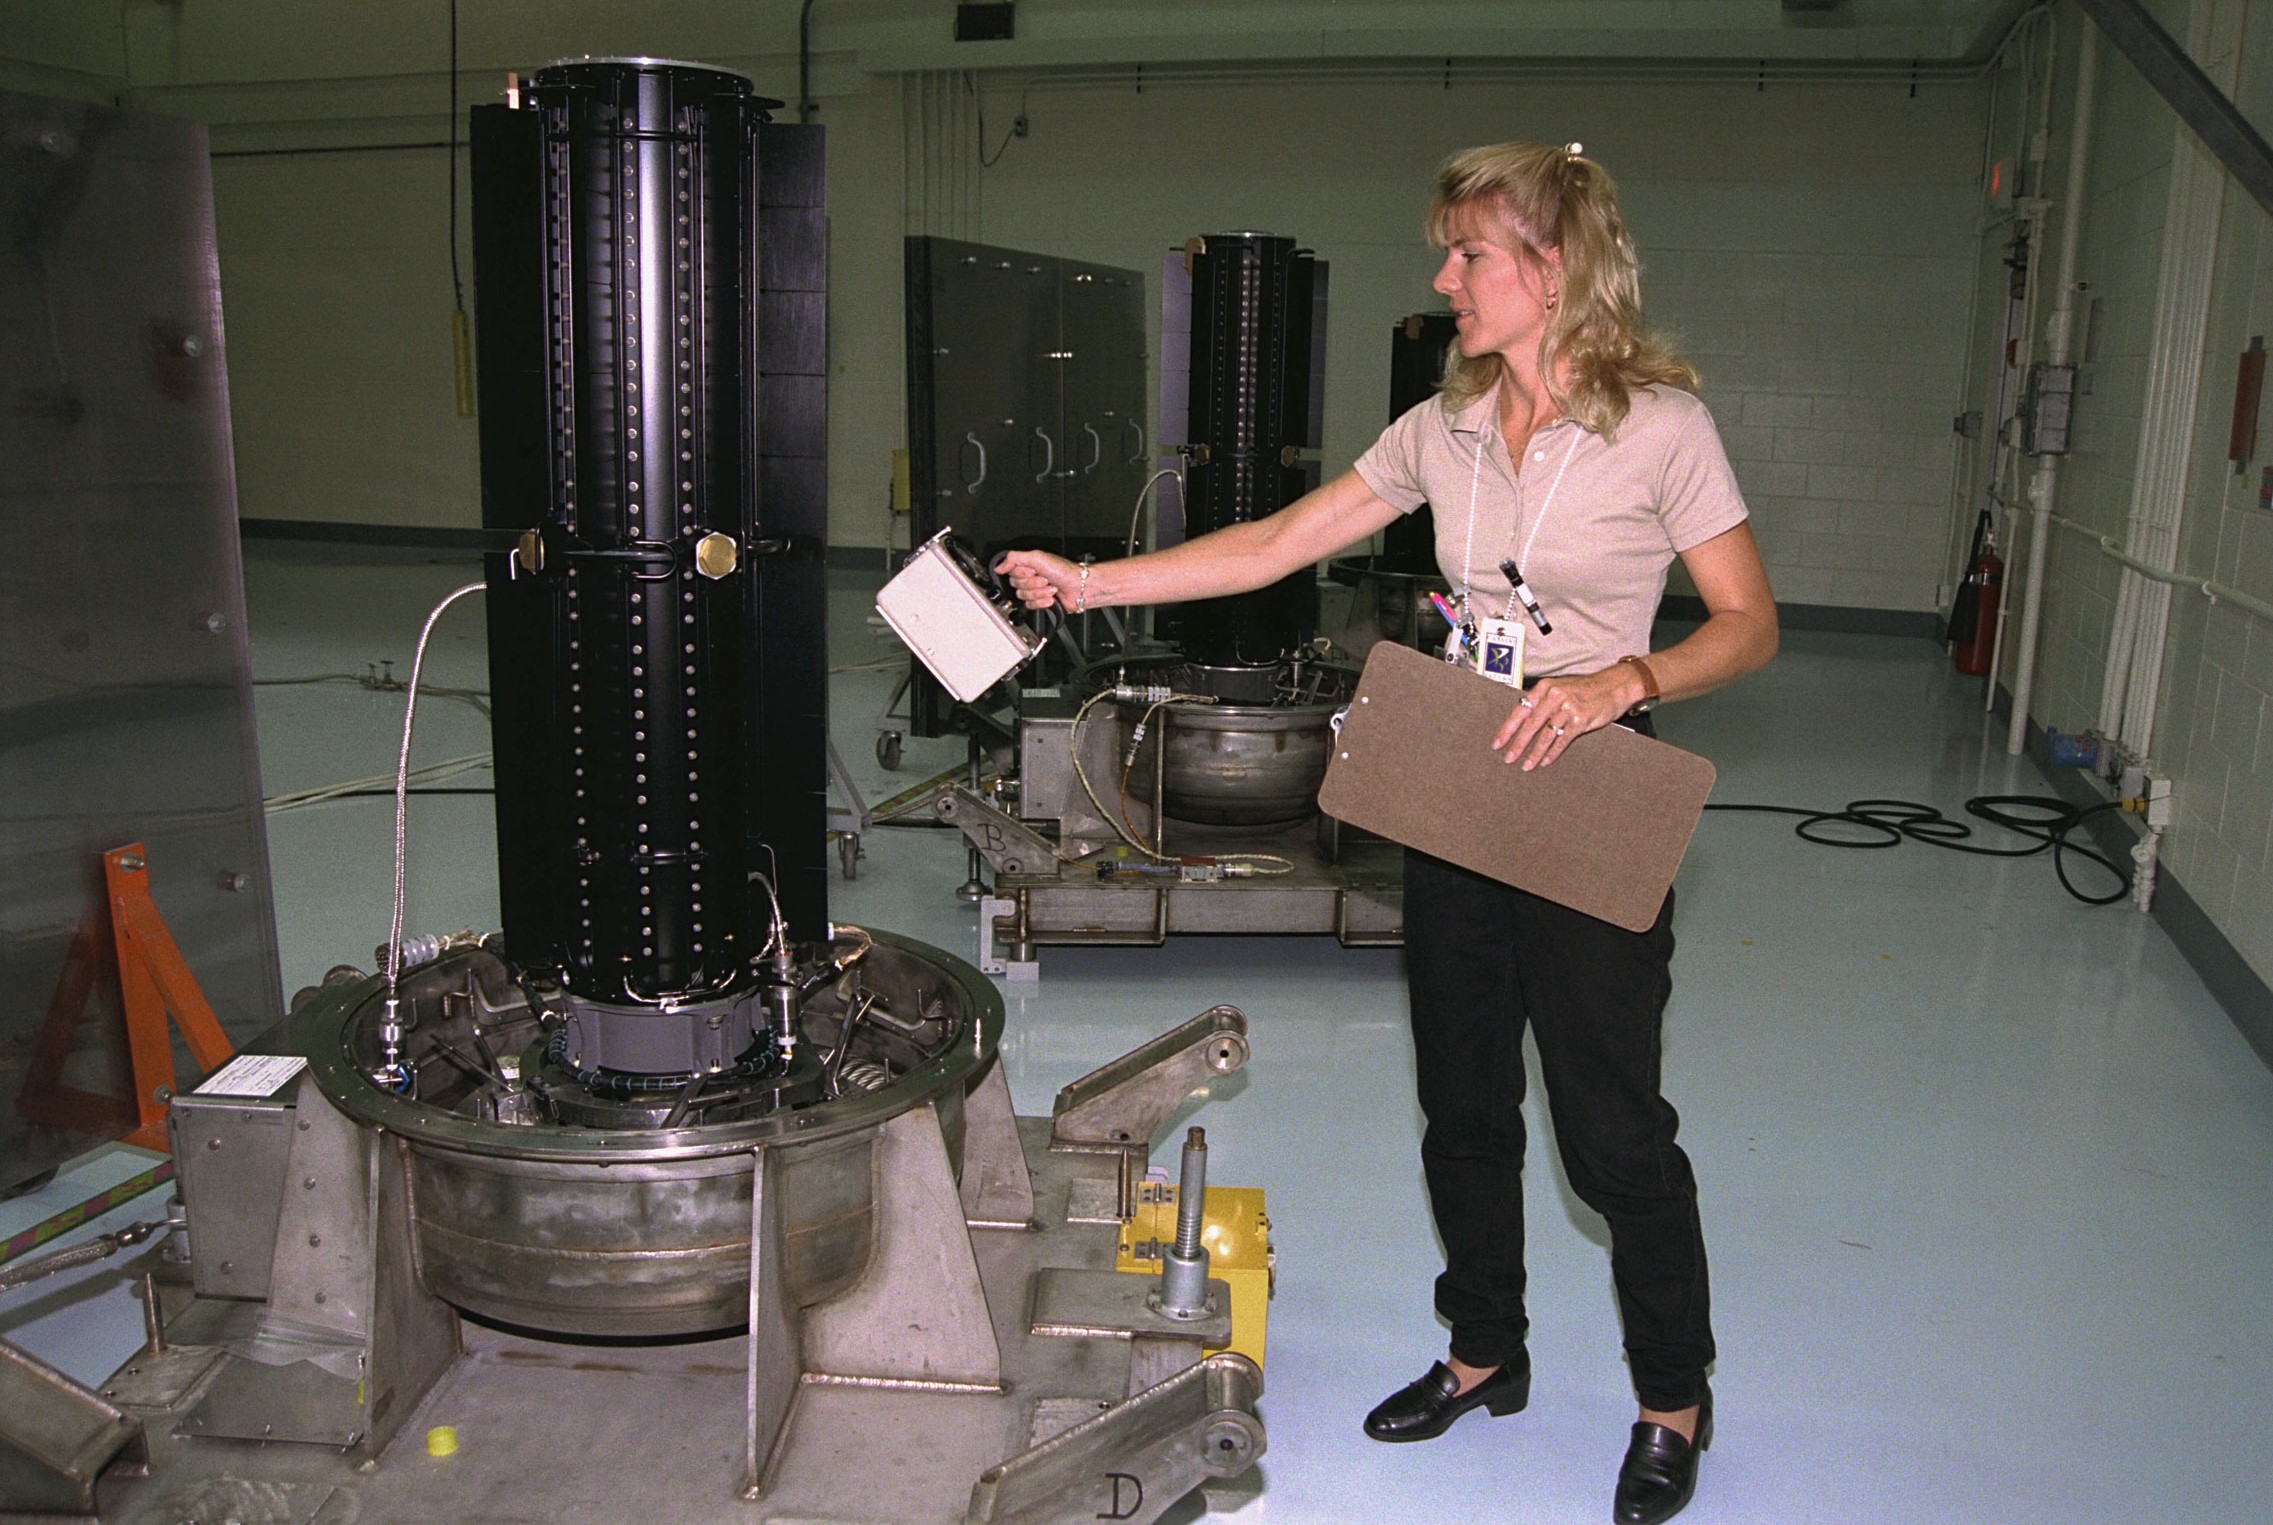
Woman measuring the radiation of an RTG.
For example, in 1961, the Transit satellites of the US military navigation system were the first ones in incorporating these RTGs. Until 1964. That year, something went wrong when putting the satellite Transit 5BN-3 in orbit and it just volatilized when reentering the Earth’s athmosphere, at the same latitude as Madagascar. Its destruction injected into the air 630 TBq (terabecquerels) of plutonium-238, whose traces were detected for months. From that moment on, it was decided that such operational satellites would be powered using solar energy, since it is less costly.
To mention another example, in 1970 and in 1973, the former USSR successfully sent to the moon a couple of robotic vehicles, Lunojod 1 and 2. But this success came after the failure, in 1969, of Lunojod 1A, a previous version that was destroyed few seconds after its launching from the Baikonur cosmodrome. The explosion produced by the rocket carrying the vehicle scattered a big amount of polonium-210 over a large area of Russia.
Back to the Apollo 13 story, the Lunar Module that sank in the sea indeed took its energy from an RTG. The fact that it fell into the Pacific ocean did not happen by chance: Tonga trench, nearly 11 kilometers deep, was chosen to minimize radioactive risks. ‘It will keep a few fish warm,’ they thought at NASA! Fortunately, engineers were smarter during this mission. Knowing that there are chances for the ships to explode, they designed a graphite coating capable of withstanding strong shocks. 1650 TBq of plutonium dioxide well deserve it.
After rescuing the astronauts, no increase of the natural radioactivity was detected in the area, so it is assumed that the device lies intact in the deep sea. Manufacturers said that the coating was able to contain the plutonium for nine centuries, and it will be not so harmful by then. However, it is logical to think that the time it will remain well protected depends on many factors, such as the bumps it received, the effect of sea water corrosion, and so on. Let’s hope the coating is as durable as they said, since there is no plan to recover it and Pacific ocean has already got enough with Fukushima nuclear disaster.
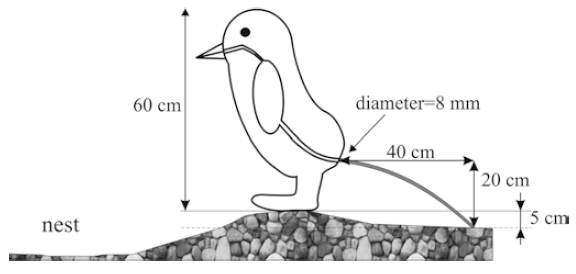
]]>When penguins pooh2015-05-03T00:00:00+00:002015-05-03T00:00:00+00:00/2015/05/03/when-penguins-poohThis post is an adaptation and translation from Spanish of an older article I wrote in 2015 on Blogger.
The penguin guano article won the Ig Nobel Prize in 2005, in the Fluid Dynamics category. These awards are given to those investigations that first make people laugh and then make them think. Beyond curiosity, the article is interesting. Apparently, there are a couple of penguin species that expel their feces by applying pressure, which allows them to keep their nests clean while remaining on the spot.
Illustration of the penguin's position as it appears in the original article.
The research made it possible to calculate this pressure, which can reach up to 60 kPa (kilopascals). To get an idea, 60 kPa is a load equivalent to half the recommended pressure in a regulation soccer ball; or almost the pressure inside an incandescent light bulb; or even three times the pressure of the sound produced by the explosion of the Krakatoa volcano 160 km away.
So, let’s be cautious: the next time we see the inanimate gaze of a penguin in a TV documentary, let’s remember that under its tail a small Krakatoa is hiding, about to explode.